Features and Screenshots of VocalTractLab
This page contains a list of the major features of VocalTractLab and a few screenshots of the program. Note that the features presented here are only a small selection. For a complete description of the functionality refer to the user manual in the download section.The central element of VocalTractLab is a three-dimensional model of the human vocal tract. This model represents the surfaces of the articulators and the vocal tract walls. An interactive visualization of the model is shown on following screenshot.
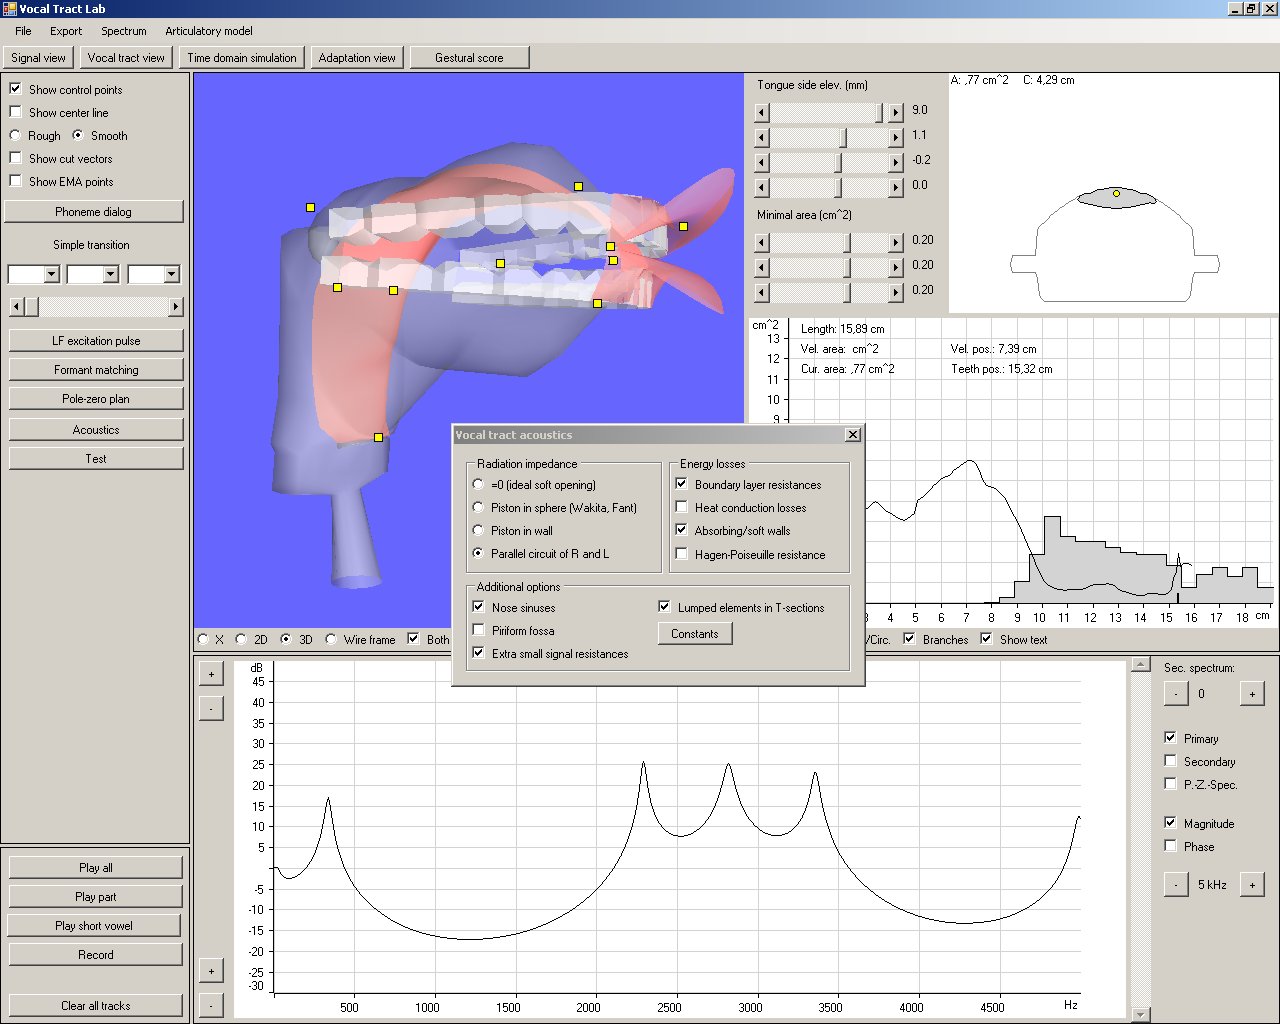
The shape and/or position of the articulators is defined by a number of vocal tract parameters. These parameters can be changed interactively by dragging the yellow control points in the vocal tract picture. The pictures on the right side display the cross section throgh the vocal tract at a selected position along the centerline (top), and the vocal tract area function (bottom). At the bottom of the screen is a graph of the volume velocity transfer function. In this place, a number of different spectra can be displayed, e.g., the vocal tract input impedance or the spectrum of the glottal source. The voiced sound corresponding to the adjusted vocal tract shape can be played any time with the button "Play part" in the bottom left panel. The dialog box shown in the center of the screen allows to make adjustments for the acoustical simulation.
The following screenshot shows the same program page, but displays a midsagittal section of the vocal tract model.
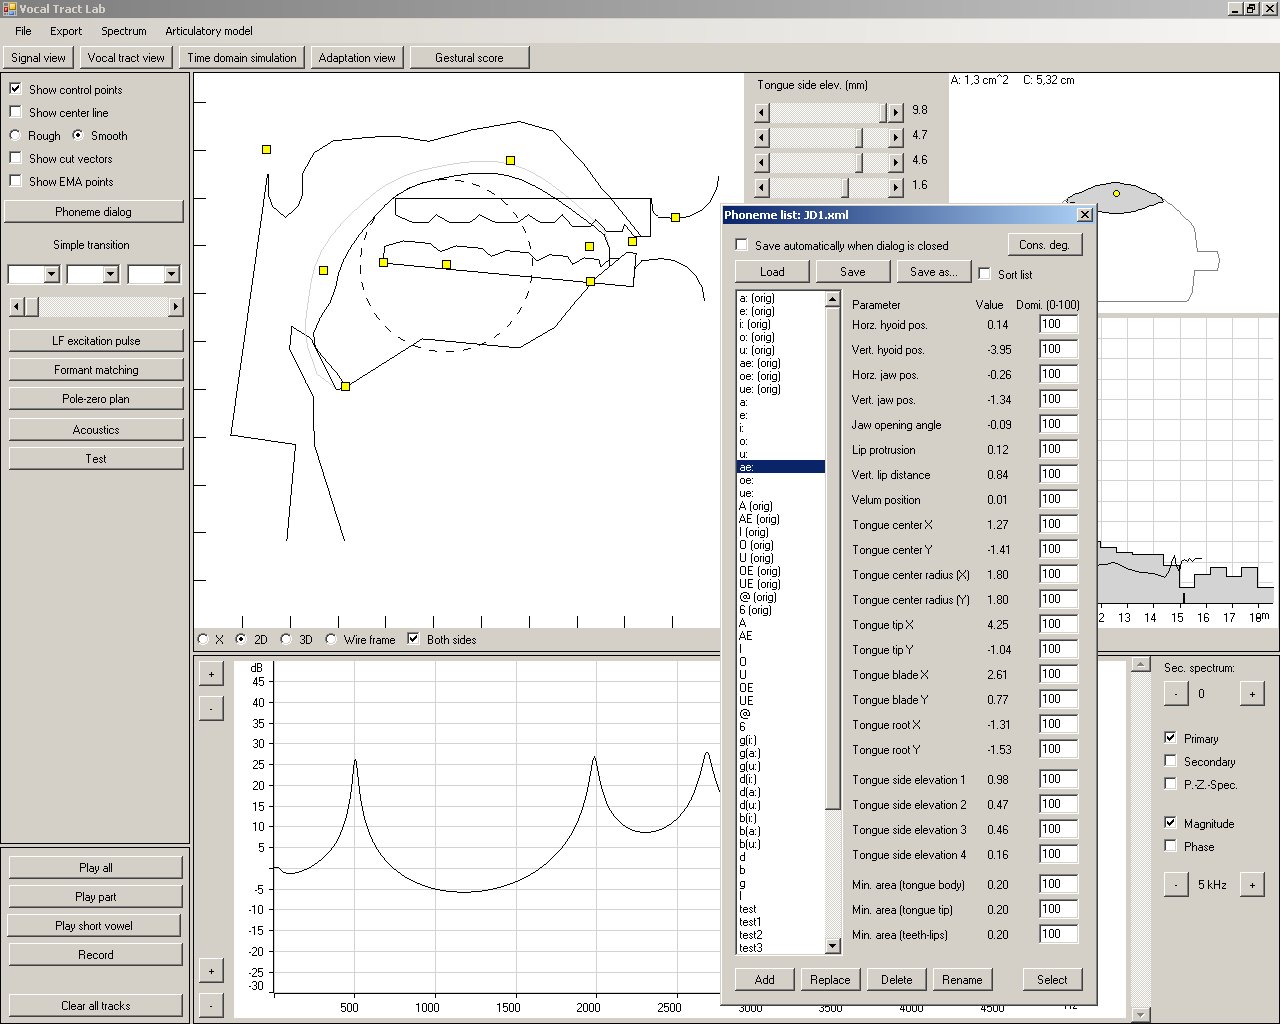
The dialog shown "on top" of the screen is a list with predefined vocal tract shapes for different vowels and consonants. Vocal tract shapes in this list were created by means of magnetic resonance images of the corresponding phonemes. New vocal tract configurations can easily be added to the list, and existing entries can be changed or deleted. The configurations in this list are used by the gestural control model to generate the speech movements for a given gestural score.
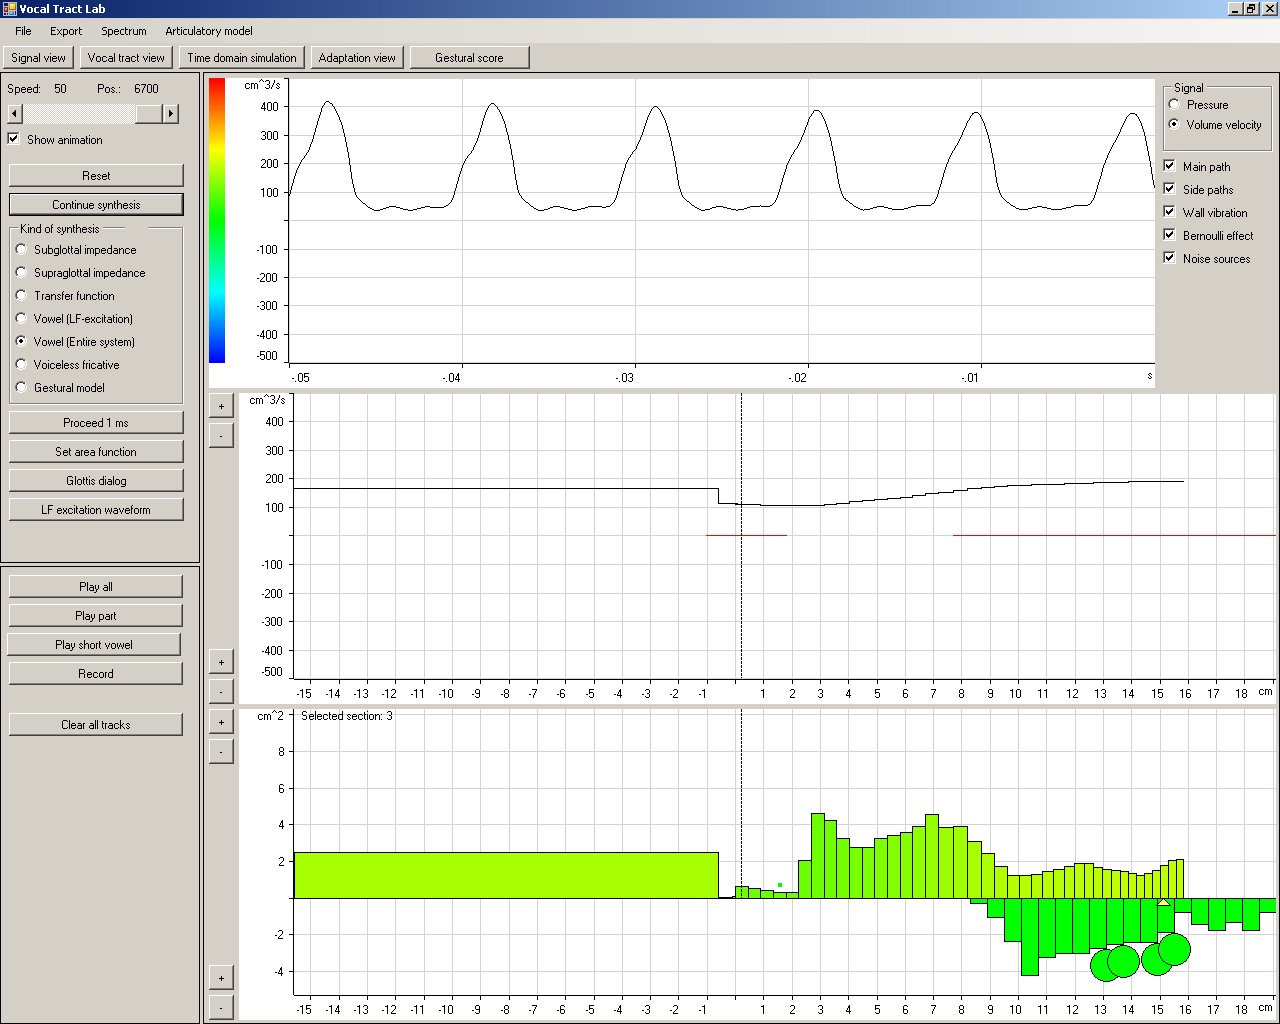
The following picture is a snapshot of an animation of the acoustic simulation of the vocal tract. The picture at the bottom of the screen displays the area function of the tube model of the vocal tract. The long tube section to the left is the trachea, and the tube sections at the right comprise the pharyngeal, oral and nasal cavities. The tube sections for the nasal cavity are flipped upside down. Paransal sinuses are represented by the green circles. The colors of the tube sections reflect the volume velocity distribution in the vocal tract according to the color scale in the top left corner of the frame. A graph of the volume velocity distribution is displayed in the middle picture. The top graph shows the last generated samples of the volume velocity signal at the position just above the glottis (marked by the vertical dashed line). This probe position can be changed to an arbitrary tube section by the user.
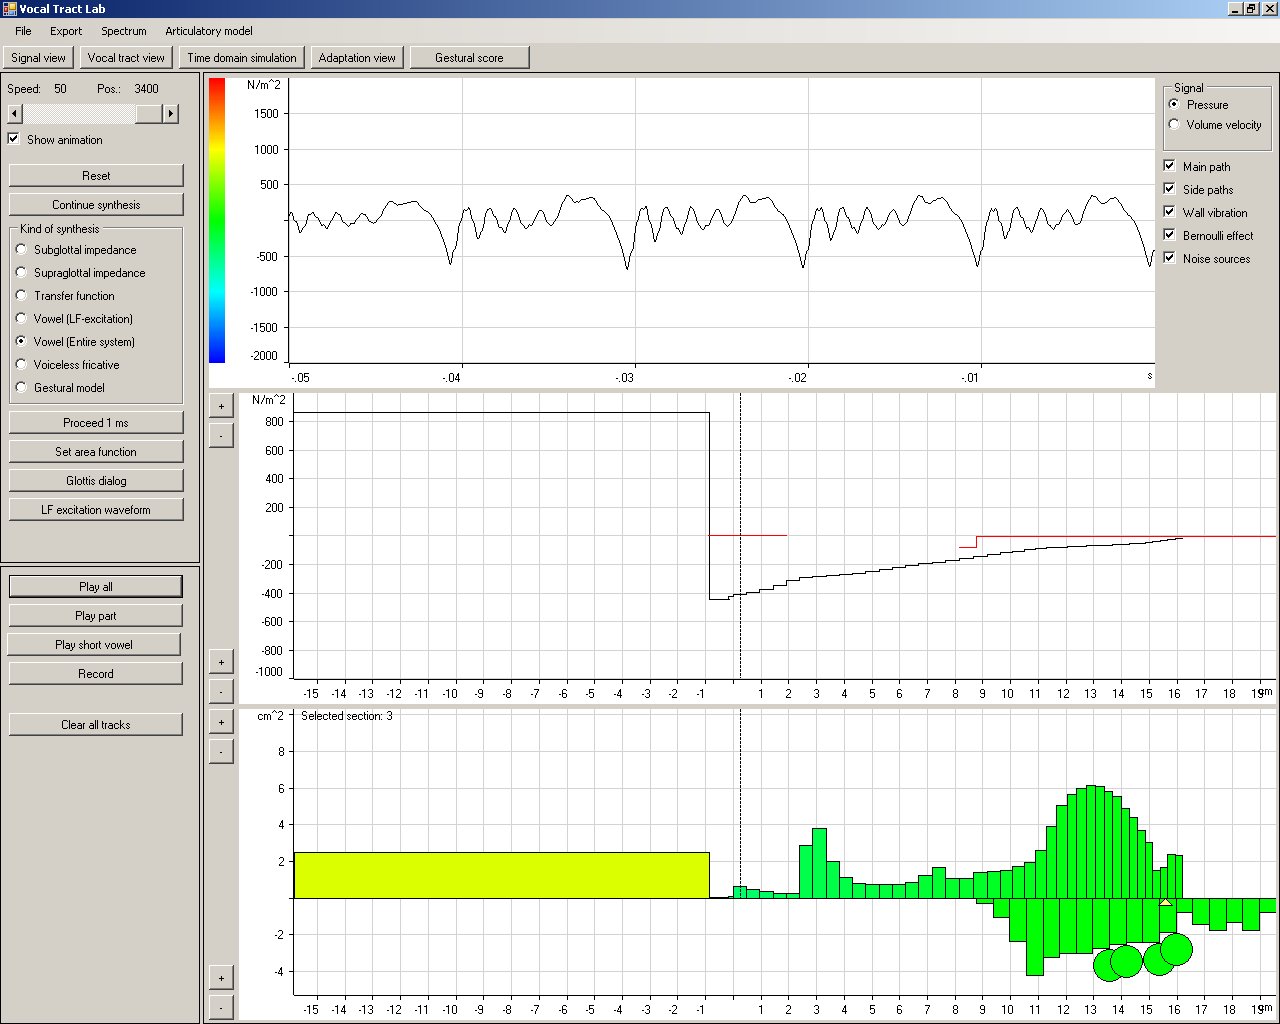
The following screenshot is similar to the one above but displays the pressure distribution in the vocal tract instead of the volume velocity distribution. Note the high pressure in the trachea and the sudden drop at the glottis.
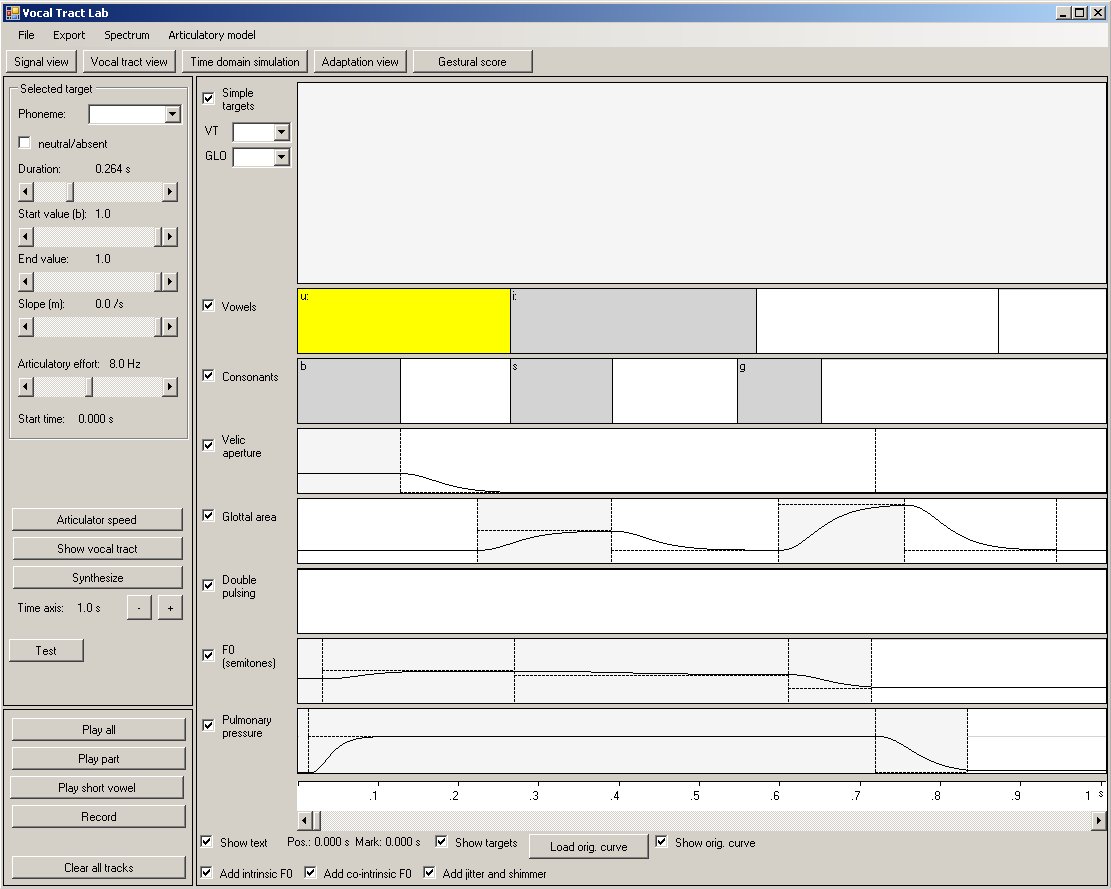
Utterances can be defined in the view shown in the following screenshot. Here, articulatory gestures can be defined and edited in the form of a gestural score, where the time axis runs from left to right. Each row contains gestures of a different type, for example "vocalic gestures", "consonantal gestures", or gestures for the change of the glottal area. The utterance generated with this score is /mu:zi:k/. In the top row, the resulting change of a selected vocal tract parameter or glottal parameter can be displayed (in this screenshot, no parameter is selected).
Some of the other features of VocalTractLab include the following.
- New since VTL 2.3 - You can generate a sequence of phonemes, define their durations and pitch values, and automatically create a gestural score from these data (see the video here). This makes it relatively easy to synthesize larger amounts of speech material with precisely defined prosodic properties.
- A custom vocal tract transfer function can be created by placing poles and zeros into an interactive diagram of the Laplace plane. This function can be compared with the transfer function of the vocal tract model in terms of the phase spectrum and the magnitude spectrum.
- The Liljencrants-Fant model for glottal excitation can be used as input to the vocal tract. Changes of the LF model parameters can be observed in the time domain and the frequency domain and be assessed by listing to the synthesized sounds.
- Standard signal processing functions like the calculation of spectra, spectrograms, LPC coefficients, etc. can be applied to the synthetic speech signals or any other sounds loaded into the application.
- A 2D or 3D vector image of the vocal tract geometry can be saved in svg-format (scalable vector graphics). Furthermore, the area functions generated by the vocal tract model can be saved as txt-files.
